Ready for Randomization
- Jan 19, 2018
- 2 min read
Hi all!
It's been a while! It has been busy here up at the Crow lab and at the Lyon Arboretum, with wrapping up our initial site characterization. We took soil samples from the soil pit on site and looked at its moisture, mineral content for elements like iron and aluminum. Why iron and aluminum? These two minerals are common within volcanic soils and are what give our special Andisol soil type their unique carbon stabilization potentials. Therefore,one of our objectives is to determine how much iron and aluminum exists in the soil at our field site at the Lyon Arboretum.

Figure 1: Soil pit at Lyon Arboretum used for initial site characterization, specifically iron and aluminum minerals which have unique carbon stabilizing properties.
We also are looking for the carbon content of the soil form these initial site characterization. Why? Because soil organic matter is high in organic carbon and is what microbes (tiny organisms in the soil) like to eat! We are interested in the amount of carbon because we would like to find out how much carbon is in the ground before our experiment. We predict that with rapid warming (by our experimental simulation of climate change warming soils) will cause more activity in the microbes and therefore less carbon in the soil. These microbes digest the carbon and then respire (breathe) it out as carbon dioxide, which is a greenhouse gas adding to the rising of earth's global temperatures.
Speaking of which! We have continued to make our carbon dioxide maps (see previous blog post) and have now formulated a map of the averaged flux (change) of carbon dioxide across the site (Figure 2). This map is important because it shows us where the carbon dioxide "hot spots" are at the site so we can avoid them so they do not skew our data.

Figure 2: The total average carbon dioxide flux map for the field site since September.
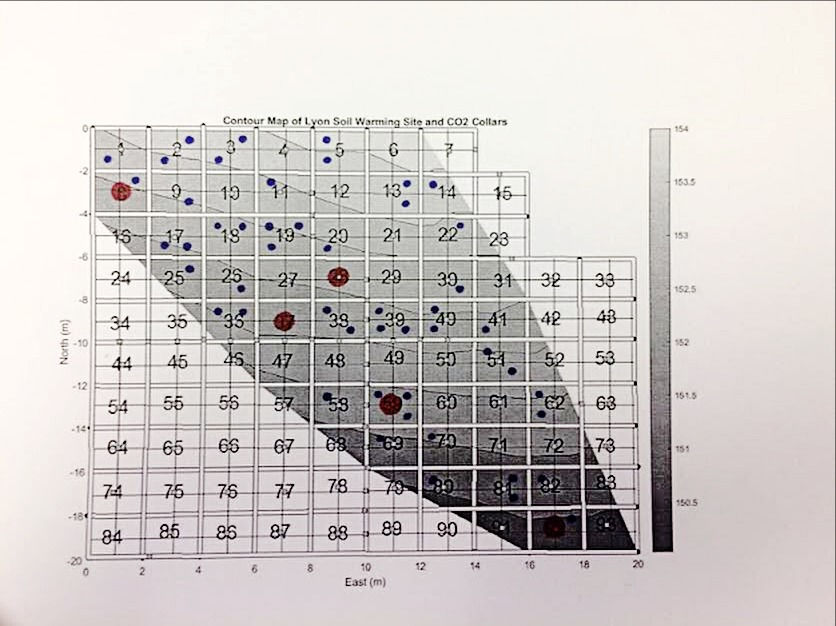
With all this site characterization near completion we are ready for randomization! The locations of the heating probes, temperature probes and gas wells across the site need to be randomized in order to eliminate bias (undesired favor of or against one location) in our data. Using the preliminary site characterization data we have collected we are able to chose all the possible locations for probes. Once we have all the possible locations established we can put them into a "random-izer" which uses atmospheric noise to generate a random order for the selection of probe locations. You can see the results of that randomization below in Figure 3!

Figure 3: The randomization grid for the field site. Randomized heating probe locations are in red while randomization temperature and gas well locations are in blue.
With the plot randomization and initial site characterization nearly finished, it's almost time to get everything in the ground! We are now starting to build the probes and temperature sensors and get them all linked up to collect data. Be sure to check back to see how progress is going!


Comments