CO2 "Heatmap" Results
- Dec 12, 2017
- 2 min read
Understanding how carbon dioxide is emitted from the soil is one of the main objectives of this study. Using our collar network we take gas samples every two weeks from the soil surface over the period of an hour. Understanding how the flux of carbon changes in this field site is important to understanding where our heating probes will go for the manipulative experiment. We want the heating probes to be added in areas where the soil is most uniform in terms of carbon flux, therefore we want to avoid adding them in areas of high flux.
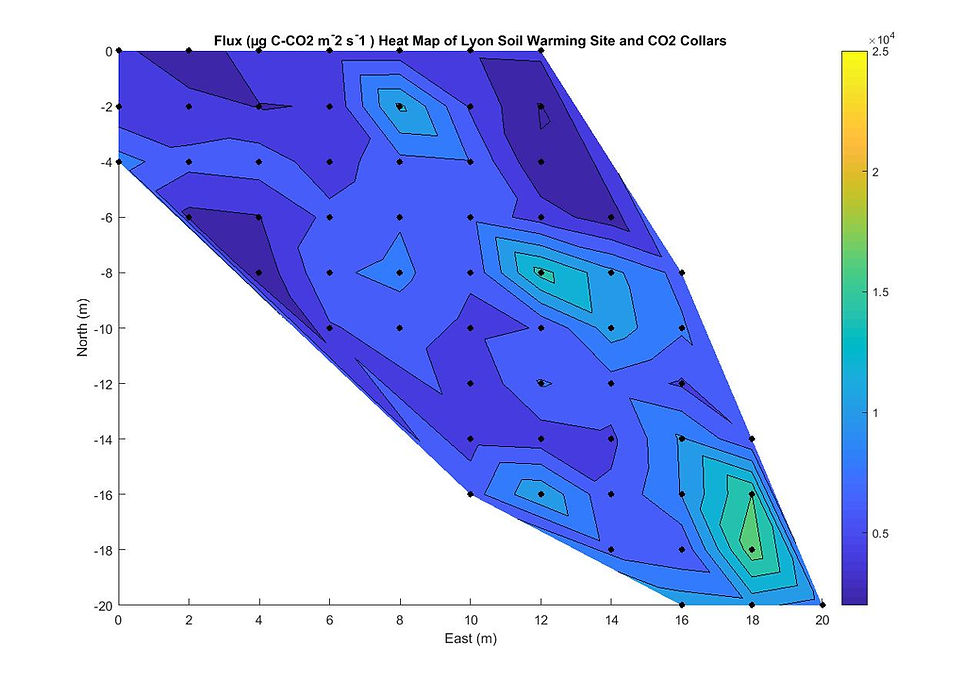
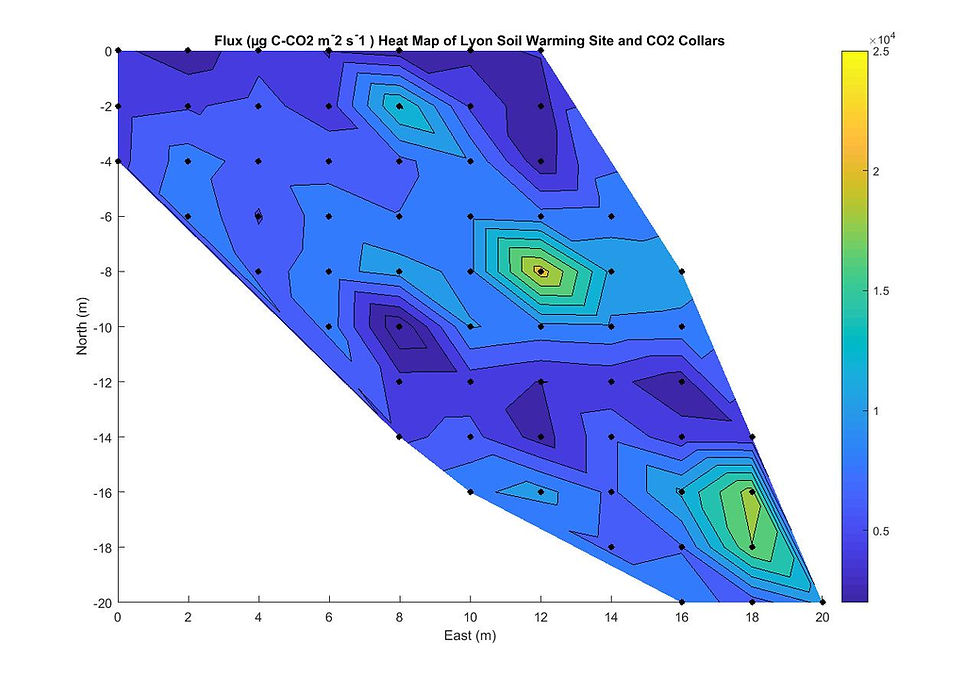
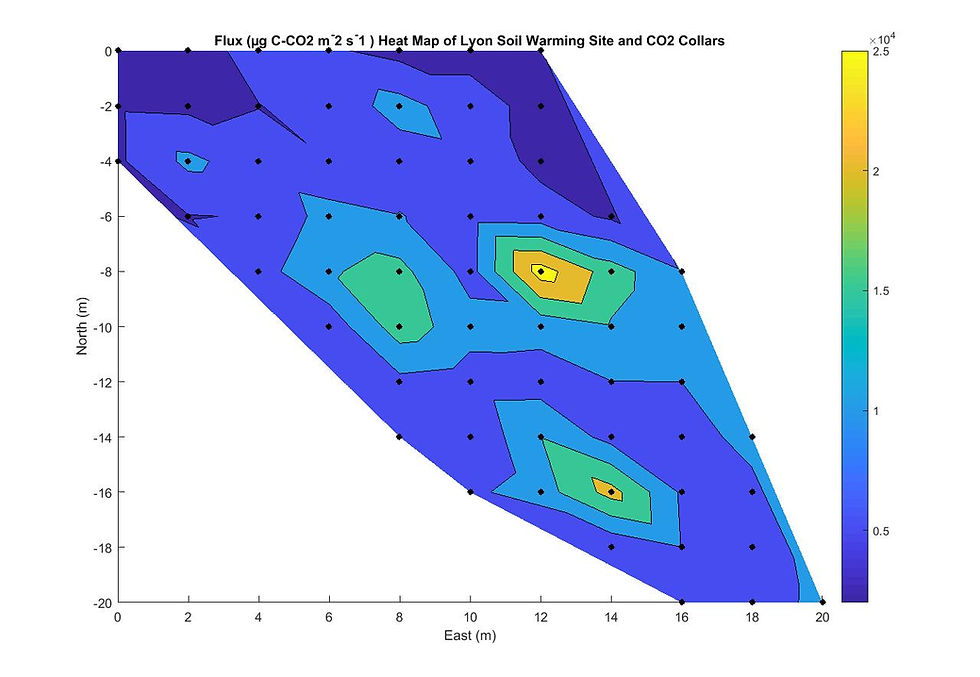
The maps below display different weather conditions across this fall sampling season. Some days were very rainy, while others were sunny and bright. Across all maps however, hot spots can be identified. These hot spots are areas of high carbon flux. These hot spots can originate for several reasons, high amounts of organic matter (ie. decaying tree stump) or an area of high activity from humans such as a footpath. Both of these areas will have higher soil respiration rates. Look at the maps below for more information.

Figure 1: Heatmap from October 10, 2017. Conditions were heavy rain. Hot spots are located around middle of site (-8,12) where a tree stump is and at bottom right (-18, 18) where a footpath is located.

Figure 2: Heatmap from October 27, 2017. Conditions were cloudy. Hot spots are again located around middle of site (-8,12) where a tree stump is and at bottom right (-18, 18) where a footpath is located.

Figure 3: Heatmap from November 11, 2017. Conditions were windy and sunny. Hot spots are still located around middle of site (-8,12) where a tree stump is but foot path hot spot is missing. Other hot spot is shown at (-16, 14) where a tree had recently fallen.


Comments